Stratisfimal Layout!
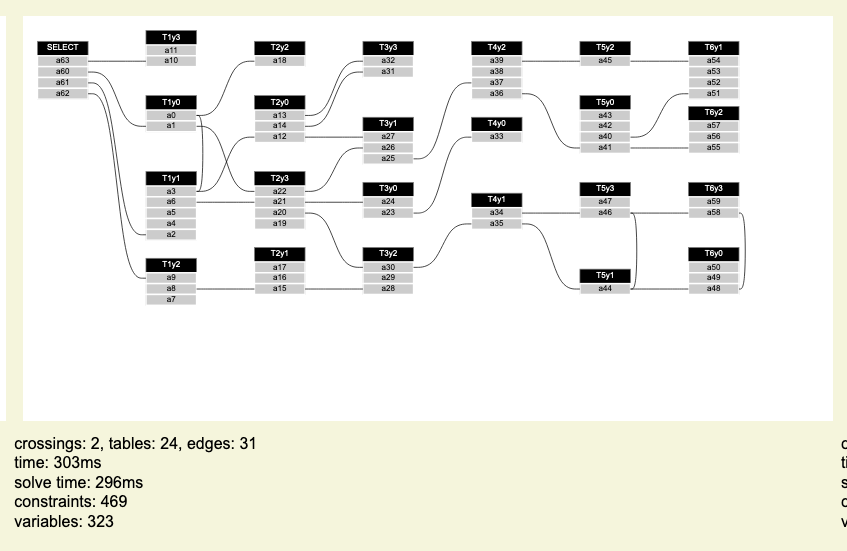
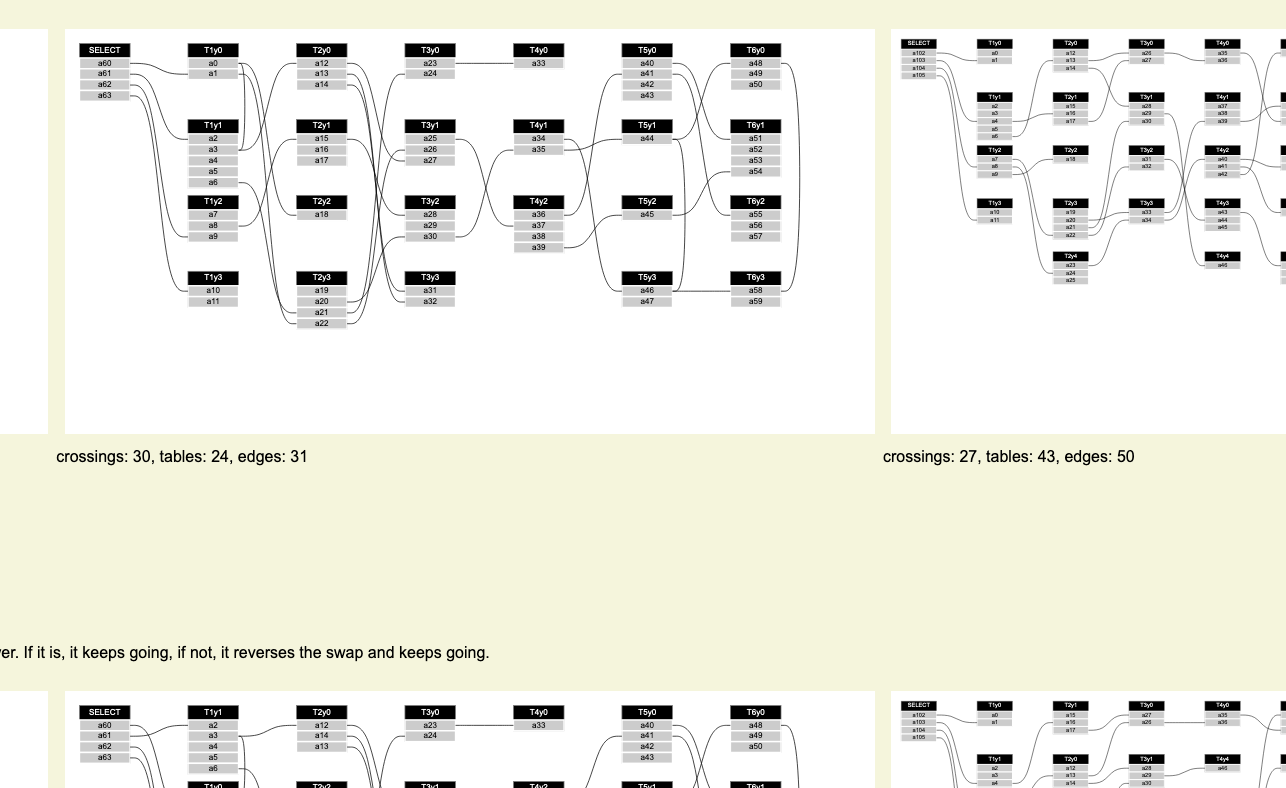
The layout of a node-link network visualization deeply influences how readable the network topology is. When trying to find a suitable algorithm for network layout, one can decide to either focus on scalability or optimality. In this paper, we focus on the latter, which is especially important as optimal solutions are not only the best attainable result, but they can also be used as a baseline to test the effectiveness of methods which do not guarantee optimality (such as methods based on heuristics, which instead focus on scalability). In the past, efforts towards optimal layout algorithms have been centered on crossing reduction, but networks can have a wide number of properties which may need to be taken into account, and there are more readability criteria other than having the smallest possible number of crossings. We make an important step towards achieving this goal by proposing a modular integer linear programming formulation for layered network layout that can take into account a number of readability criteria suggested in the past (e.g., crossing reduction, edge bendiness, nested and multi-rank grouping) that can all be solved simultaneously. Our method can be adapted to numerous, different use cases due to its modularity, which allows for modules to be cherry-picked according to which features are needed.
Features
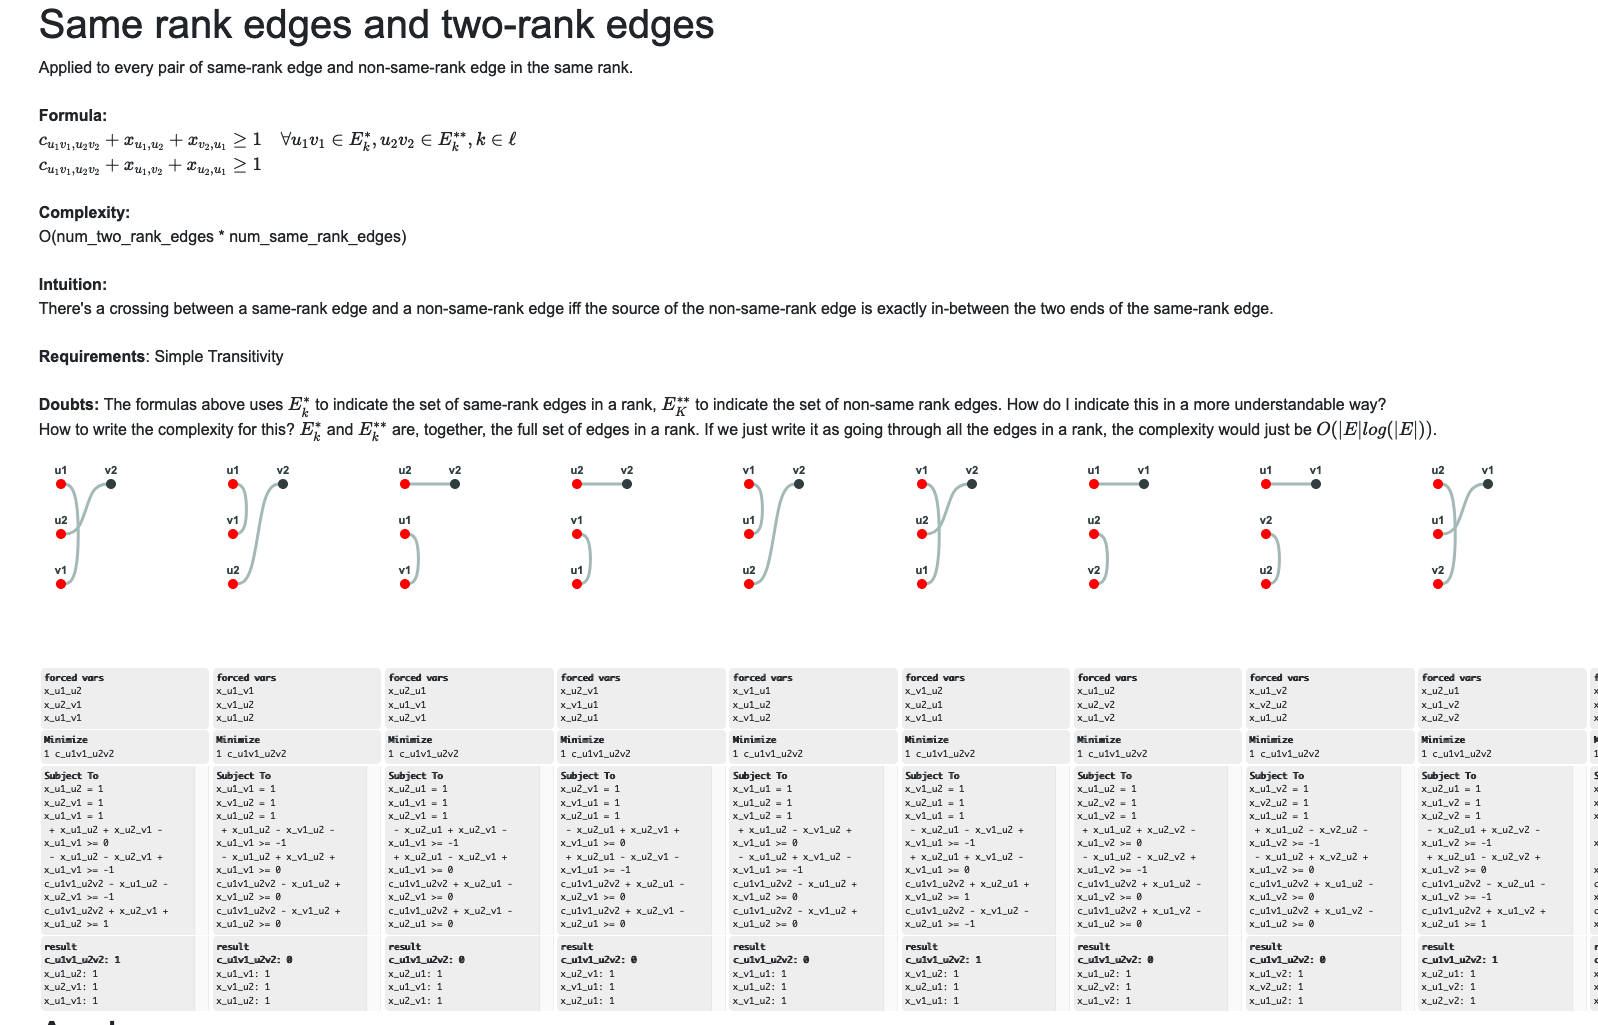
- Crossing reduction in layered node-link network visualizations
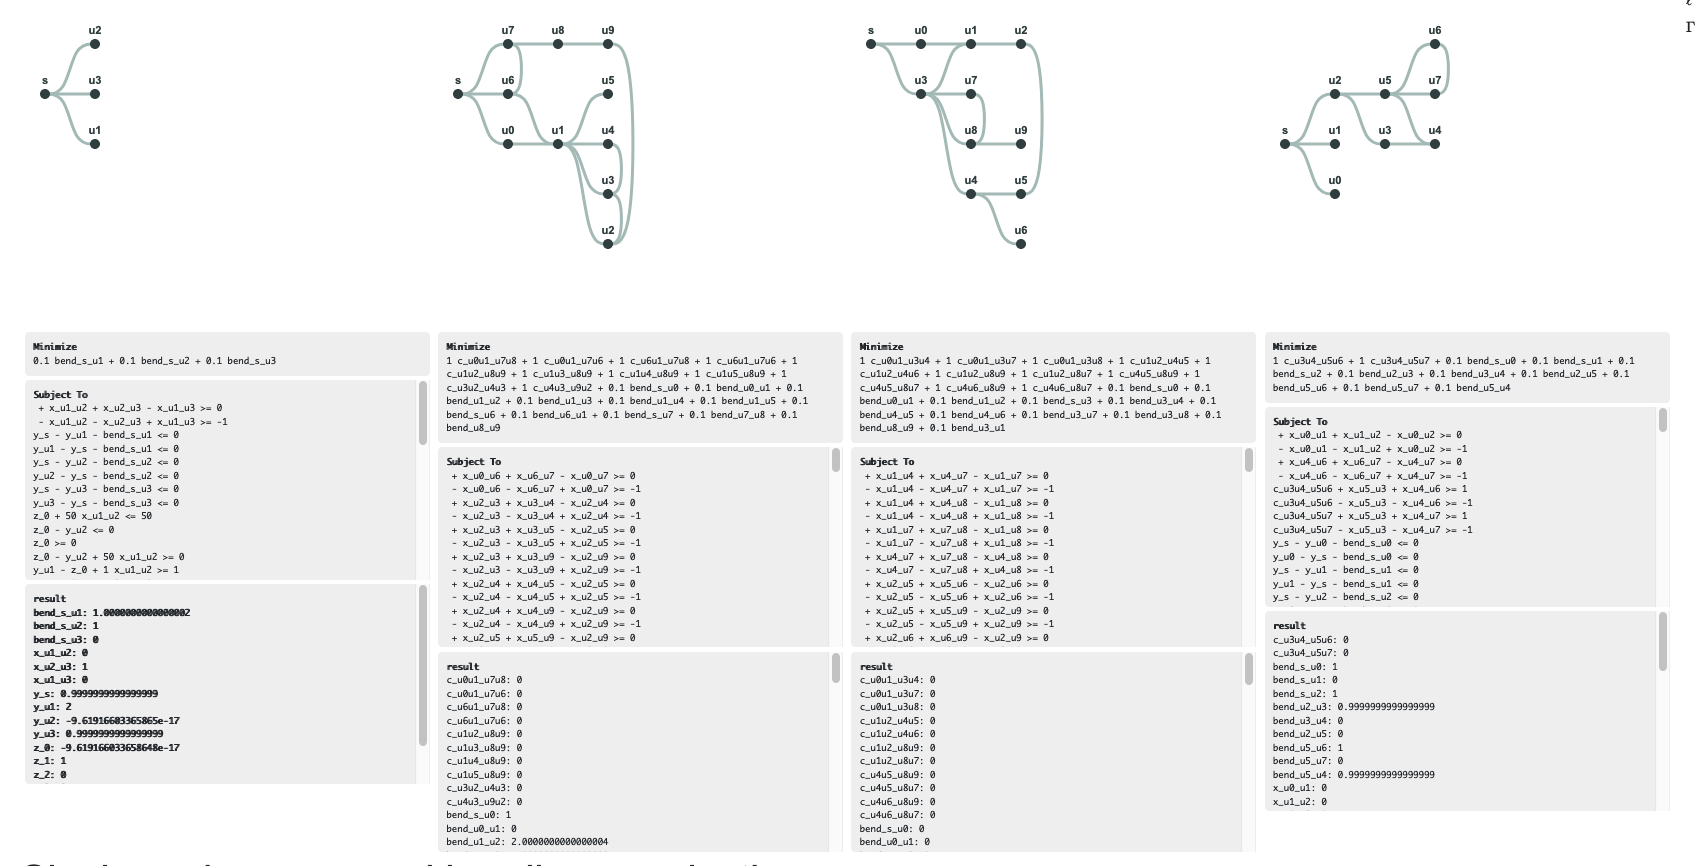
- Bendiness reduction
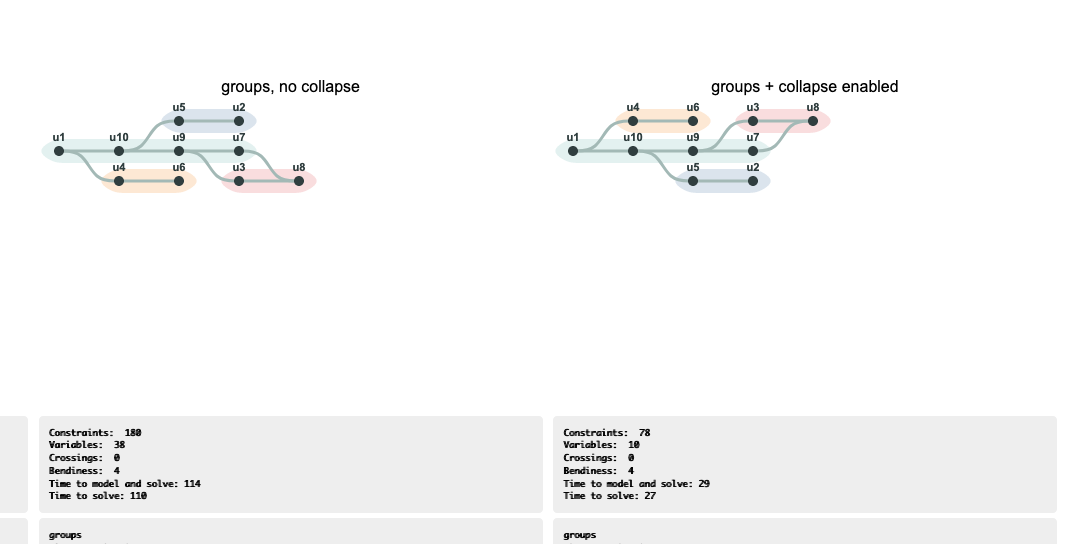
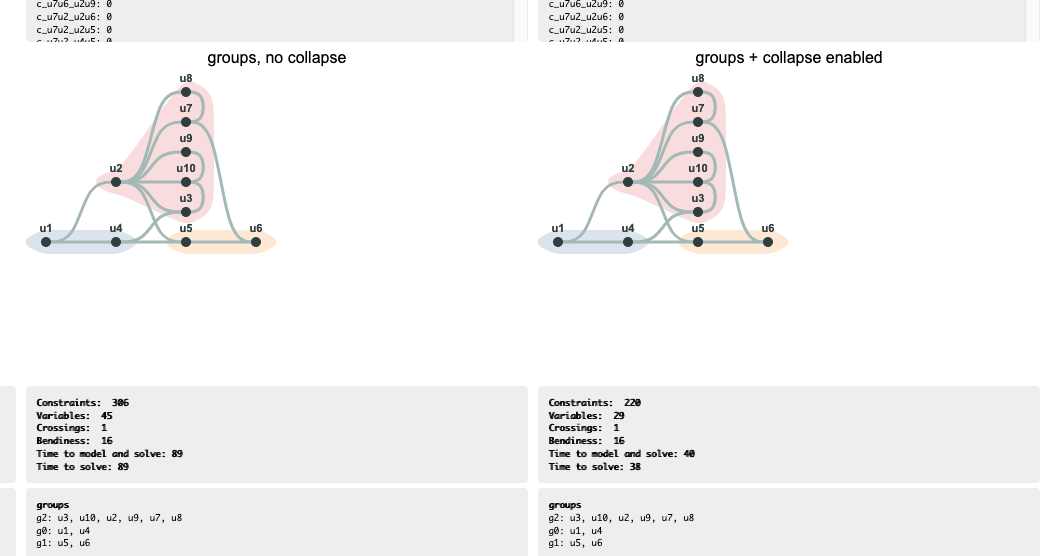
- Manages single-rank, multi-rank and nested groups
- Always finds the optimal solution
Resources
Try it yourself
Note: the result is computed in your browser, so it might take some time.
{
  "nodes": [
    {"id": "u1"},
    {"id": "u2"},
    {"id": "u3"},
    {"id": "u4"}
  ],
  "edges": [
    {"nodes": ["u1", "u2"]},
    {"nodes": ["u1", "u3"]},
    {"nodes": ["u2", "u4"]}
  ]
}
Usage
let g = readFromJson(file);addGroups(g);let algorithm = new SimpleLp(g);let options = {crossings_reduction_weight: 1,
crossings_reduction_active: true,
bendiness_reduction_weight: 0.1,
bendiness_reduction_active: false,
simplify_for_groups_enabled: true,
keep_groups_rect: true
}
algorithm.options = options;algorithm.arrange();algorithm.apply_solution();g.draw(svg);Authors
Sara Di Bartolomeo, Mirek Riedewald, Wolfgang Gatterbauer, and Cody Dunne
A product of Data Visualization @ Khoury and the DATA Lab @ Northeastern University
Acknowledgements
d3, svg management library used for drawing the networks.
glpk.js, GNU Linear Programming Kit for Javascript.